引言
2016是我来北京第一年,这年年末和2017年的年初,雾霾在这个城市肆虐了一个冬天,还记得那时候每天出门都要带着口罩,卡着眼镜戴的特别难受。在公司里大家也时不时的讨论着空气质量、哪款口罩质量比较好、中午要不要出去吃饭等等与雾霾有关的话题。本科四年在哈尔滨,那时候冬天的雾虽然存在,但也没有让人感到窒息,研究生在武汉的三年也未见满大街都带着口罩的壮观景象。所以当时的想法是,连基本的生存都要成问题,还谈何工作、生活?既然无法改变空气质量,那可以做的就是选择一个空气质量说得过去的城市。于是选择了十个城市,在空气质量网站上爬了2017年连续一年的空气质量,分别是北京、上海、杭州、珠海、深圳、广州、成都、苏州、厦门、哈尔滨。这些城市主要是以经济发展空间这个维度来选择的,个人认为也是我们这代人比较有倾向性的久居城市(哈尔滨是hometown,纯属关心;武汉呆了几年,觉得以后再也不会去了)。
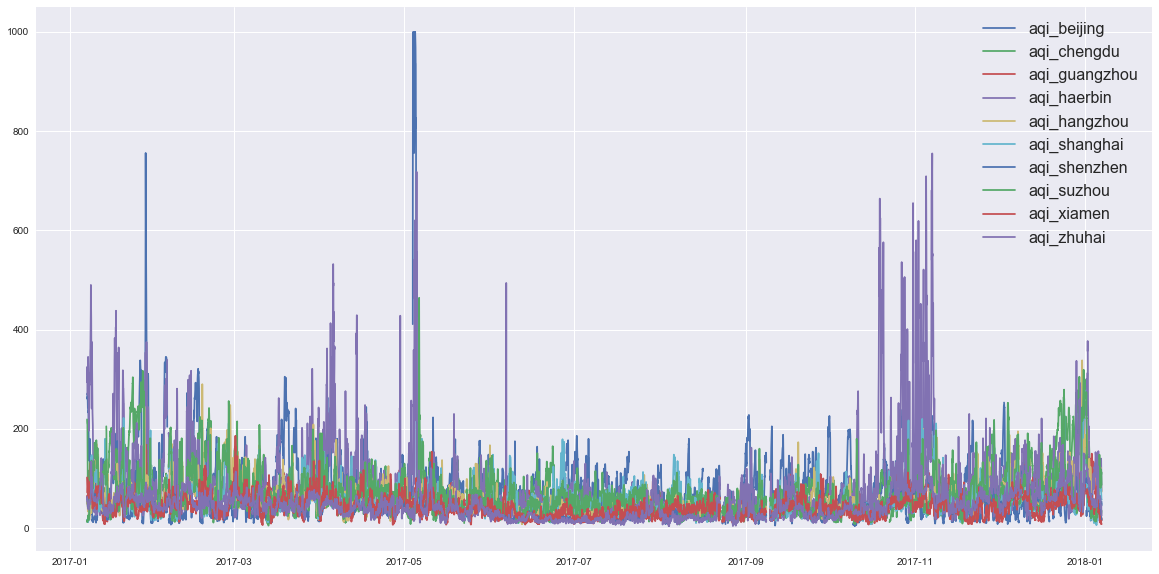
爬虫代码在服务器上crontab每五分钟一次定时执行,最终结果最小粒度为小时,个别时间因为不明原因数据缺失。
爬虫
|
|
分析
|
|
|
|
|
|
|
|
|
|
|
|
|
|
|
|
|
|
|
|
|
|
|
|
结论:
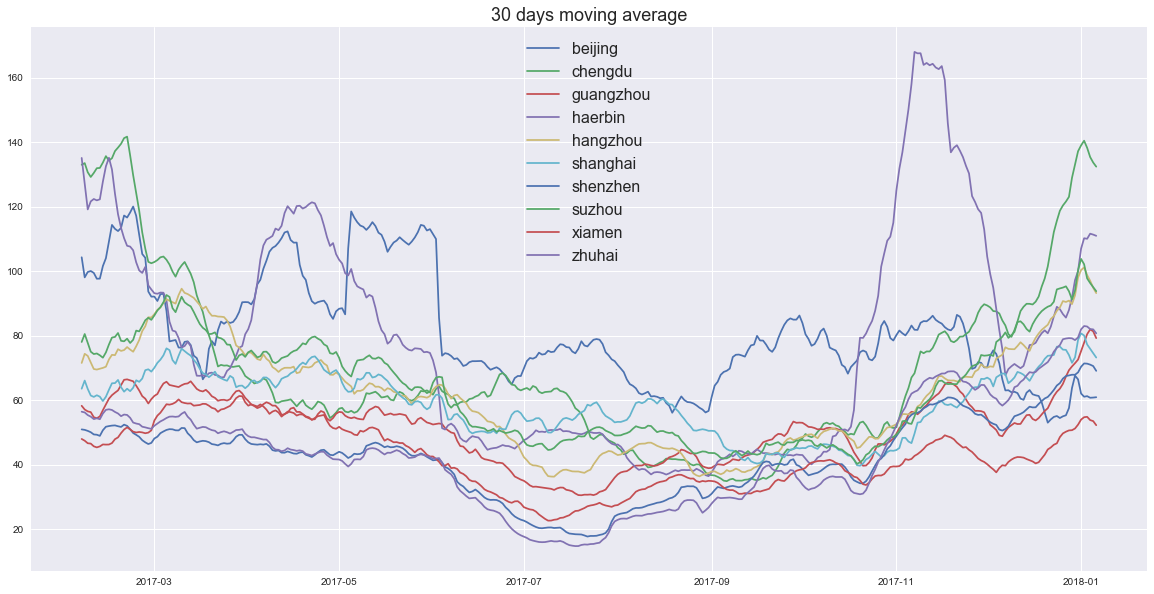
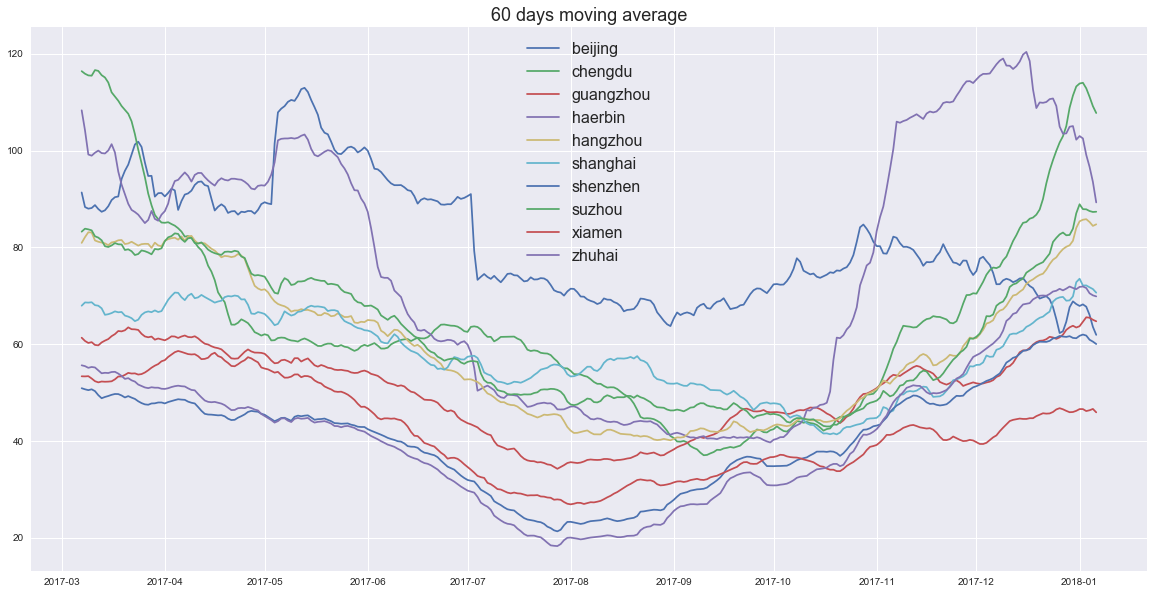
- 滑动平均结果显示,夏季空气质量优于冬季
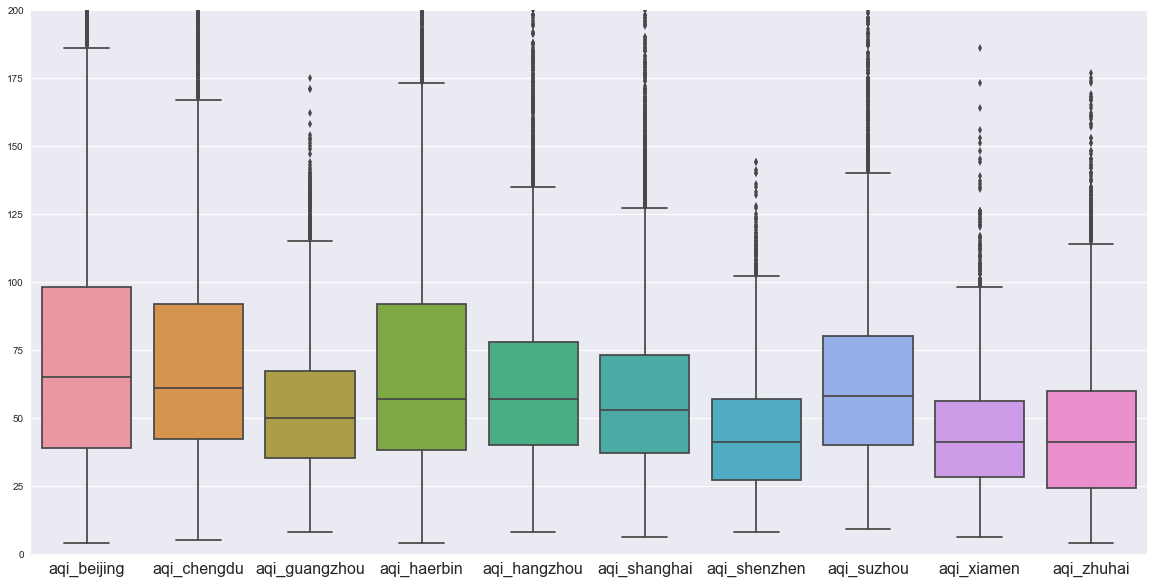
- 箱型图显示,南方沿海城市空气质量优于北方,且异常值很少且不会很异常,即,再差也差不到哪去
- 北京2017年冬季空气质量有明显好转,与相关政策干预河北省有关
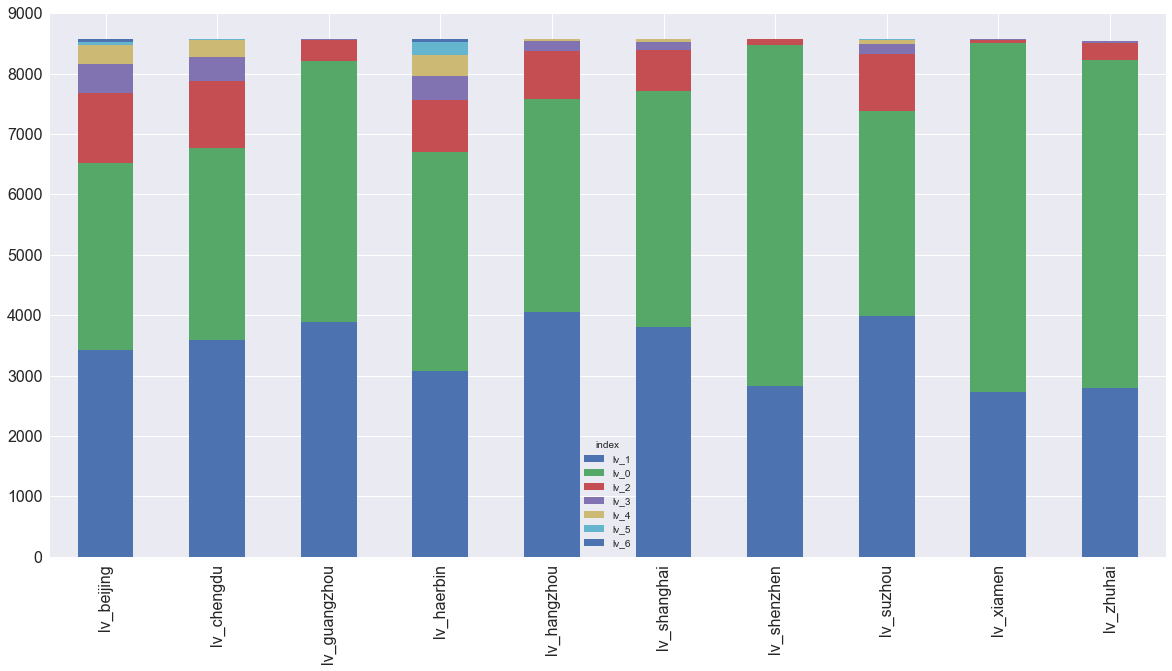
- 哈尔滨和北京半斤八两,夏季哈尔滨是赢家,冬季北京是赢家。极度恶劣空气状况频率哈尔滨是赢家
- 在这个政策主导和经纬度跨度极大的国家,空气质量受到很多因素的影响,过去一年的统计结果未来未必依然具有说服力
(待更新)
全年中国空气质量分布图的动态展示